2018 O Level Chem P1 Q19 — Speed of Reaction / Rate Graphs Solution
Question
Video Solution
Explanation
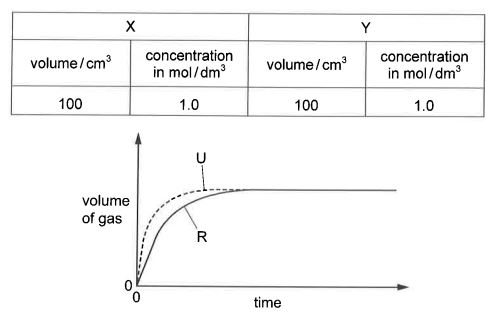
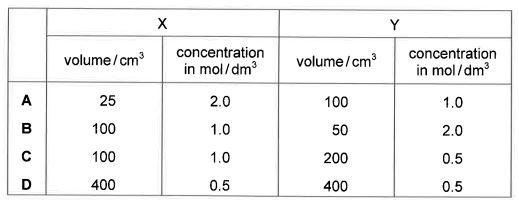
Answer: B (X: 100 cm³ at 1.0 mol/dm³; Y: 50 cm³ at 2.0 mol/dm³). The final volume of gas (the plateau) is proportional to the moles of limiting reactant, while a higher concentration gives a steeper initial gradient.
Line R uses \(n(\text{X}) = n(\text{Y}) = 0.100\) mol. Curve U plateaus at the same height as R, so U uses the same moles (0.100 mol), but U rises more steeply, so its reactants are more concentrated.
Option B gives \(n(\text{X}) = 0.100 \times 1.0 = 0.100\) mol and \(n(\text{Y}) = 0.050 \times 2.0 = 0.100\) mol (same plateau as R), with Y at 2.0 mol/dm³ giving the steeper start. Options A gives too little gas; C is not more concentrated; D doubles the moles, so its plateau would be twice as high. Answer B.
Get the Sec 3 / Sec 4 recording package
Every O Level Pure Chemistry TYS MCQ solution video, plus full Sec 3 / Sec 4 topic recordings.
Find out more