2017 O Level Chem P1 Q16 — Speed of Reaction / Rate Graphs Solution
Question
A student added excess hydrochloric acid to calcium carbonate. As the reaction proceeded he measured the volume of carbon dioxide released, at room temperature and pressure, and plotted a graph. CaCO₃(s) + 2HCl(aq) → CaCl₂(aq) + CO₂(g) + H₂O(l) What can the student conclude from the information? 1 The number of moles of calcium carbonate used was 1.67 × 10⁻². 2 During the reaction, the rate steadily increased. 3 After 15 minutes, the reaction has stopped.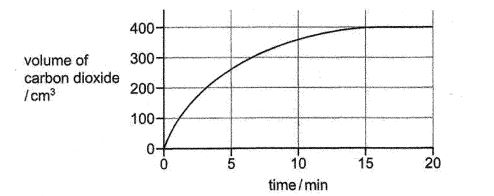
Correct answer: C
Video Solution
Explanation
Answer: C. Statement 1 is correct: the gas levels off at 400 cm³, which is \(400 \div 24000 = 1.67 \times 10^{-2}\) mol of \(\text{CO}_2\), equal to the moles of calcium carbonate used. Statement 3 is correct: the curve becomes flat at about 15 minutes, so the reaction has stopped.
Statement 2 is wrong: the rate is greatest at the start and decreases with time (the curve gets less steep). So 1 and 3 only.
Get the Sec 3 / Sec 4 recording package
Every O Level Pure Chemistry TYS MCQ solution video, plus full Sec 3 / Sec 4 topic recordings.
Find out more